
Does the distance between branches in a Scleractinia coral change as a function of depth?
Bellot Charlotte and Khayi Mounaim
INTRODUCTION
Pocillopora is a genus of hexacorallien Cnidaria belonging to the Pocilloporidae family. This species is most commonly named cauliflower coral. Actually, 28 different species are known but this study will be focus on Rasp coral (Pocillopora verrucosa) which is widespread distributed across the Pacific Ocean. These corals are quite tolerant to humans' activities; thus, we can find them within anthropological marine structures. Generally, the size of their branches is homogeneous, and the diameter does not exceed 50 cm [Richier et al. 2008]. Their distribution could go from 0 to 54 meters depth, but it is more common to see them in shallow depth waters and they rarely growth after 20 meters depth [1; Richier et al. 2008]. It is well known now that it exists an endosymbiosis between
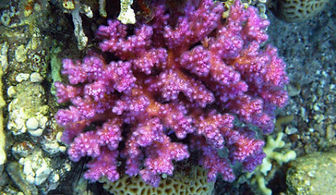
the Rasp coral and several clades of Zooxanthellae (unicellular algae which is responsible of the photosynthesis which provides the different colours to corals depending on pigments presents in it). Hirose et al. (2000) showed that zooxanthellae play a role in the growth of corals through photosynthesis by providing essentials nutrients in the tissues of the host
For years now, scientists try to understand which factors influence the ecology of corals (growth, distribution, mortality…) and how they interfere on these events. Thereby, we know that light has an influence on the diversity of shapes in corals [Chindapol et al. 2013]. Indeed, because of the endosymbiosis with Zooxanthellae, the light appears to be the main source of energy for the photosynthesis and so, one of the factor of growing for corals. We assume that corals grow to reach a maximum of light radiation in order to increase their fitness. Furthermore, it has been proved that hydrodynamism also influences the forms of corals [Chindapol et al. 2013; Edmunds & Burgess 2017]. Indeed, corals tend to get a more open growth form with a low flow while the compact shape is favoured through a high current. This could be explained because water motion plays a role in the passive diffusion of oxygen in the branches (through gradients mechanism) and thus, sparely spacing branching structures allow flow to penetrate deeper inside the colony. Here again, we can assume that diversity of shapes within corals occur because of fitness reason. We can also assume that the nutrient composition of the environment interferes in the same time than flow on the growth form of the coral.
Moreover, the Symbiodinium clade diversity may be responsible of the distribution of P. verrucosa in different depths. The change of clade could provide to the coral different skills and an adaptation to the environmental changes occurring with depth such as light, pressure, current [Iglesias-Pietro et al. 2004; Spencer Davies 1989] … We already know that depending on the depth, the growth rate is different and tend to decrease with depth which is correlated with the loss of light intensity [Spencer Davies 1989].
In this study, we will try to go further in the understanding of the distribution of corals within reefs. Here, we would like to investigate if depth and age of the coral could influence the distance between branches of the coral (response variable). Thus, because the composition and motion of water change with depth, we assume that this factor will have an effect on the distance between branches. On the other hand, we assume that the size of the coral does not influence on the response variable because it is more likely that external factors are involved on this phenotypic trait than physiological factors.
MATERIAL & METHODS
Fieldwork location
Collected data comes from the Red Sea near El Quseir, Egypt (N26°6'24.53'' / E34°16'27.69'') at two different spots on both South and North of El Quseir. The fieldwork was done during one week by the end of April 2017.
Data collection
To answer questions, pictures of P. verrucosa were taken using a Gopro (Rollei AC 510) at different depths. A maximum of different range of size per depth were also picked to obtain a complete sample. These pictures compose the basis of the dataset. The sample size is 75 different corals hand out at different places more or less close to the land to increase the diversity of environmental conditions present at these locations. Before each picture, a net with knowing spacing (5cm * 5cm) was placed on the coral as a scale to measure the distance between branches (see Figure 1).
Measurements
The photogrammetric part of the study was done using Photoshop software. Four different spacing (InterSpace Pocillopora: IPS1, 2, 3 and 4) were randomly chosen and measured for each coral, then, the average of these measures was calculated (Average InterSpace Pocillopora: AIPS). Finally, the diameter of the coral was calculated and used as the size of the coral (Coral Size); corals were classified in three different range of size: [0 - 10], [10 - 20], [20+] respectively small, medium and large coral (Supplemental information Table 1).
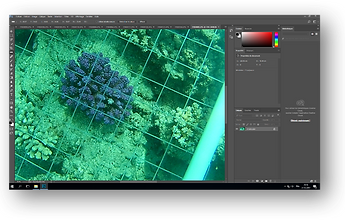
Figure 1. Screenshot of Photoshop Software during the analyse of one coral.
Data Analyses
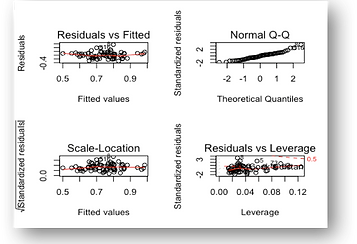
Then, to analyse the data, R Studio 1.1.383 software was used. The first step was to run two Pearson's tests to investigate the possible correlation between the variables (Depth & Age) with the response variable (Distance between branches). After that, a multiple regression was run to see which variable has the biggest influence on the spacing between branches (this step required to check the residuals of models, Figure 2).
Figure 2. Residuals of models
Results
Correlation between Depth & Branches Spacing
To test the relationship between the depth and the distance between branches of P. verrucosa, we decided to run a Pearson’s test which allow to highlight the correlation between two quantitative variables: depth and space between branches (Table 1).
The p-value is 0.0048 (<0.05), meaning that there is a correlation between depth and space between branches. The value of Pearson’s correlation is -0.3217 (r). There is a low negative relationship between depth and space between branches (Graph 1).
cor.test (Depth , AIPS)
Pearson's product-moment correlation
data: Depth and AIPS
t = -2.9038, df = 73, p-value = 0.004874
alternative hypothesis: true correlation is not equal to 0
95 percent confidence interval: -0.5114000 -0.1022968
sample estimates:
cor -0.3217875
Table 1: Result of Pearson's test between 2 variables, Depth and Branches Spacing
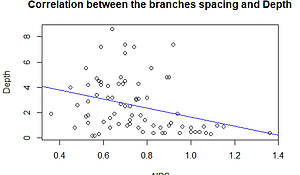
Graph 1. Relationship between the interspace of branches and depth
Correlation between Coral Size & Branches Spacing
Because we would like to know if the size of the coral has an influence on the response variable, we also ran a Pearson's test (Table 2).
The p value is 0.00729 (<0.05), so there is a correlation between the size and the space between branches of P. verrucosa. The value of Pearson’s correlation is 0.3074 (r) meaning that there is a low positive relationship between these two variables (Graph 2).
cor.test (coral size , AIPS)
Pearson's product-moment correlation
data: coral size and AIPS
t = 2.7607, df = 73, p-value = 0.00729
alternative hypothesis: true correlation is not equal to 0
95 percent confidence interval: 0.08653826 0.49956266
sample estimates:
cor 0.3074613
Table 2: Result of Pearson's test between 2 variables, coral size and branches spacing
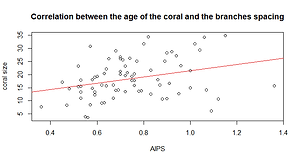
Graph 2. Relationship between the Age of the coral and the spacing between branches
Correlation between Coral Size & Depth
Finally, we would like to investigate if the depth could have an influence on the size of corals (Table 3).
The p value is 0.0303 (<0.05), so there is a correlation between the size and the depth of P. verrucosa. The value of Pearson’s correlation is 0.2503 (r) meaning that there is a low positive relationship between these two variables (Graph 3).
cor.test (Depth , `coral size`)
Pearson's product-moment correlation
data: Depth and coral size
t = 2.2091, df = 73, p-value = 0.0303
alternative hypothesis: true correlation is not equal to 0
95 percent confidence interval: 0.02477422 0.45163094
sample estimates:
cor 0.2503285
Table 3: Result of Pearson's test between 2 variables, coral size and depth
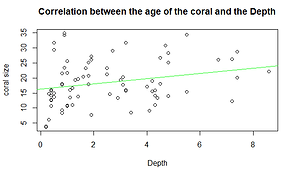
Graph 3. Relationship between the Age of the coral and depth
Main effect on the Branches Spacing
At this point, it would be interesting to know which of these explanatory variables play a preponderant role on the distance between branches of the coral. A multiple regression was used to test that.
Previous results can be confirmed using the principle of parsimony which consists in running a main effect model containing the two explanatory variables, then, a reduced model containing a single variable. Finally, using an ANOVA, these models will be compared.
model1= lm (AIPS ~ Depth + coral size + Depth: coral size)
Call:
lm(formula = AIPS ~ Depth + `coral size` + Depth:`coral size`)
Coefficients:
Estimate Std. Error t value Pr(>|t|)
(Intercept) 0.693633 0.075089 9.238 8.56e-14 ***
Depth -0.061396 0.027267 -2.252 0.0274 *
`coral size` 0.008147 0.003916 2.080 0.0411 *
Depth:`coral size` 0.001140 0.001272 0.896 0.3732
---
Signif. codes: 0 ‘***’ 0.001 ‘**’ 0.01 ‘*’ 0.05 ‘.’ 0.1 ‘ ’ 1
Residual standard error: 0.1663 on 71 degrees of freedom
Multiple R-squared: 0.2724, Adjusted R-squared: 0.2417
F-statistic: 8.86 on 3 and 71 DF, p-value: 4.593e-05
Table 4: Multiple regression for the main effect
The p-value of the model is 4.59e-05 (<0.05), meaning that this model is reliable (Table 4). Now we run a model without the interaction between the explanatory variable (Table 5).
model12 = lm (AIPS ~ Depth + `coral size`)
Coefficients:
Estimate Std. Error t value Pr(>|t|)
(Intercept) 0.646340 0.053346 12.116 < 2e-16 ***
Depth -0.038477 0.009444 -4.074 0.000117 ***
`coral size` 0.010689 0.002696 3.964 0.000172 ***
---
Signif. codes: 0 ‘***’ 0.001 ‘**’ 0.01 ‘*’ 0.05 ‘.’ 0.1 ‘ ’ 1
Residual standard error: 0.1661 on 72 degrees of freedom
Multiple R-squared: 0.2642, Adjusted R-squared: 0.2437
F-statistic: 12.92 on 2 and 72 DF, p-value: 1.6e-05
Table 5: Multiple regression for the main effect model without interaction term
The model is still reliable (p-value = 1.6e-05). We ran ANOVA to compare nested models with deletion tests (Table 6).
Table 6: Comparison of nested models using ANOVA
The comparison betweens the two models found that the interaction between depth and coral size did not have a statistically significant effect on the spacing between branches.
We apply the same principle to the variable depth and coral size model2=lm(AIPS~Depth) model3=lm(AIPS~`coral size`)
Table 7: Comparison of nested models using ANOVA
This test show that removing depth or coral size from the main effect model result in a highly significant change ( p<0.00017 and p<0.00011). So coral size and depth are statistically significant and so there is no need for further model reduction (Table 7).
Now, to check the relative importance of these two variables we must first transform our data into z-score and then rerun model1 renamed model11 (Table 8).
model11 = lm (scale (AIPS)~ scale (Depth)+ scale (coral size))
Coefficients:
Estimate Std. Error t value Pr(>|t|)
(Intercept) 7.607e-17 1.004e-01 0.000 1.000000
scale(Depth) -4.254e-01 1.044e-01 -4.074 0.000117 ***
scale(`coral size`) 4.140e-01 1.044e-01 3.964 0.000172 ***
---
Signif. codes: 0 ‘***’ 0.001 ‘**’ 0.01 ‘*’ 0.05 ‘.’ 0.1 ‘ ’ 1
Residual standard error: 0.8696 on 72 degrees of freedom
Multiple R-squared: 0.2642, Adjusted R-squared: 0.2437
F-statistic: 12.92 on 2 and 72 DF, p-value: 1.6e-05
Table 8: multiple regression of model11
The relative value of the slope of the two explanatory variables is quite similar (-4.25e-01 and 4.14e-01), meaning that both depth and P. verrucosa size act with the same force on the space between the branches of the coral. However, depth shows a negative relationship with the response variable instead of the coral size showing a positive relationship. We also noticed that these two variables explain only 24% of the variation of P. verrucosa interspace branches (Graph 4).
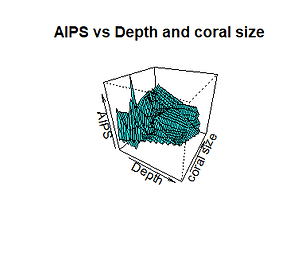
Graph 4. Relationship between the spacing between branches and the age of the coral and depth
Discussion
Correlation between Depth & Branches Spacing
By analyzing the correlation between Depth and Branches Spacing, we showed that there is a negative relationship meaning that the space between the branches tend to decrease with depth. We assume that because of the difference of the flow in the shallow and deep waters, the shape change with depth. Thus, we know that current is stronger in the surface than deeper and so, corals need to grow to reach a maximum of nutrients, as said above, the space between branches favored the absorption. This fact could explain why we find more sparely spacing branches in shallow waters than in deeper waters. These differences in shape could be a strategy used by corals to increase their fitness. LIGHT
Correlaion between Size & Branches Spacing
Results showed a positive relationship between the size of corals and the spacing between branches. In other words, the interspace between branches increases with the overall size of the coral. We so assume that the age of the coral influences its shape. This result seems logical if we consider that bigger corals needs more nutrients, their spacing become bigger to increase the passive diffusion of oxygen which will increase the amount of nutrients release by Zooxanthellae.
Correlation between Size & Depth
Finally, the correlation between the size of the coral and the depth also showed a positive relationship between these explanatory variables. Thus, the size of corals increases with depth. This point is more difficult to explain because we don't have evidence that size and age are correlated. We assumed that bigger corals are also older than the small ones. These results showed that corals tend to be bigger in deep waters. The two assumptions raised are:
-
Anthropic disturbance in shallow waters is greater than deeper and thus, corals suffer more and must adapt their growth to this factor. And because corals in unfavourable environment grow slowly, this could explain why we find smaller individuals in shallow waters [Chindapol et al. 2013].
-
The intensity of the light tends to slightly decrease with depth, deeper corals must expand their surface to capture a maximum of light which provides the energy for the photosynthesis of the zooxanthellae. As we know that this is important because they release essentials nutrients for the coral with the products of the photosynthesis, it seems normal that corals in deep waters are bigger than the other ones.
Further investigations could be to measure intensity of light at different depth to test the correlation between light and branches spacing and confirm our present assumptions on light effects. Also, because light influences the quantity of zooxanthellae within corals [Hirose et al. 2000], it could be interesting to measuring if there is any changes in colours with depth.
Conclusion
At the end of this analysis, we clearly see that environmental changes influence the ecology of the species Pocillopora verrucosa. However, in nature the compound effect of several variables is more likely to explain the ecology of the species and scientists always have to relate to the other factors and their own influences on the target species to understand and do not miss out on important information such as reaction of the species to thermal stress (main factor of bleaching) ... Thus, our analyses need supplemental research to have an exhaustive understanding of the species. Thereby, we will be able to manage conservation measures against bleaching and other threats.
References
Chindapol N. et al. (2013) 'Modelling Growth and Form of the Scleractinian Coral Pocillopora verrucosa and the Influence of Hydrodynamics.' PLoS Comput Biol 9(1): e1002849. doi:10.1371/journal.pcbi.1002849
Edmunds P.J. & Burgess S.C. (2017) 'Colony size and turbulent flow speed modulate the calcification response of the coral Pocillopora verrucosa to temperature' Marine Biology 165: 13
Hirose M. et al. (2000) 'Early Development of Zooxanthella-containing eggs of the corals Pocillopora verrucosa and P. eydouxi with special reference to the distribution of Zooxanthellae' Biol. Bull. 199: 68 - 75
Iglesias-Prieto R. et al. (2004) 'Different algal symbionts explain the vertical distribution of dominant reef corals in the eastern Pacific' Proc. R, Soc. Lond. B 271, 1757 – 1763 DOI 10.1098/rspb.2004.2757
Richier S. et al. (2008) 'Depth-dependant response to light of the reef building coral, Pocillopora verrucosa: Implication of oxidative stress' Journal of Experimental Marine Biology and Ecology 357 48 - 56
Spencer Davies P. (1989) 'Short-term growth measurements of corals using an accurate buoyant weighing technique' Marine Biology 101, 389 – 395